
28 May Unemployment Demographics
As the workforce development board serving Mecklenburg County, Charlotte Works leads the way in connecting job seekers and employers, providing skills training and work opportunities for youth and adults, analyzing and sharing data to educate the public on workforce needs, and aligning community partners around workforce initiatives to help make Charlotte-Mecklenburg a place of economic opportunity for all.
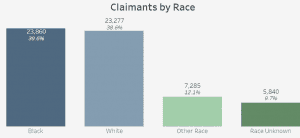
April Data by Race
UPDATE 6/1: Since this article was originally published unemployment claim data was also released for the month of April. In the month of April, unemployment claims by race were not only disproportional, but the absolute number of claims by the Black/African American community was greater than the total number of claims by White residents.
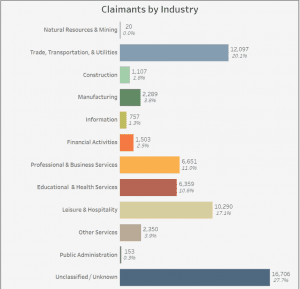
April Claim Data by Industry
Additionally, we now see new claims in the month of April were greatest in the Trade, Transportation, and Utilities industry.
We will continue to monitor new information and provide updates to our article with additional context as new unemployment data is released.
Charlotte Works brings you a comprehensive report detailing the impact of COVID-19 unemployment claims (UI) on Mecklenburg County residents. The goal is to provide important context around NC Commerce data to determine what communities have been most impacted by the pandemic. When contextualizing this data, we see disproportionately impacted communities and industries, specifically those with lower amounts of wealth and less ability to withstand this crisis. This report will subsequently be broken down by industry, age, gender, and race.
First, what industries were most impacted by layoffs?
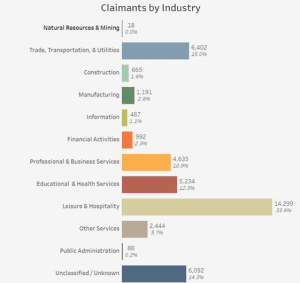
March Claim Data by Industry
While all industries are dealing with the effects of COVID-19, the Hospitality industry has been impacted the most, with over a third of the total UI claims representing individuals from this industry. The next three industries (Trade, Transportation & Utilities; Professional & Business Services; and Education & Health services) represent a combined total of 16,271 unemployed individuals, which is just slightly higher than the 14,299 individuals impacted in the Hospitality industry alone. This is reflected further by the fact that 2.5 million jobs were lost in April in the healthcare and education industries (Jones, 2020) alone. The graph by Industry shows the differences between these impacted industries in greater detail.
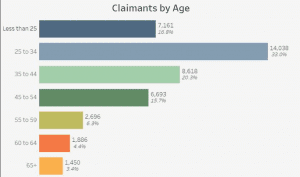
March Claim Data by Age
Understanding the industries that have been hardest hit, we can also begin to see why there are disparities in the ages of unemployment claimants. For example, the Leisure and Hospitality industry shows a 77% decrease in jobs for April alone (Jones, 2020). According to our findings, younger populations disproportionately represent these suffering industries. Younger employees predominantly work in retail and customer service spaces, which currently reflect a 32% unemployment rate among teenage demographics (Jones, 2020). A Gusto study found that employees who earn less than $20/HR are 115% more likely to be laid off than individuals who make $30/HR (Jones, 2020). This, in addition to data showing that individuals under 25 are 93% more likely to lose their jobs than those 35 or older, illustrates a glaring disparity regarding age (Jones, 2020). With just over a fifth (22%) of Mecklenburg County’s population representing the 25-34 age group, a third (33%) of that same demographic are currently filing for unemployment. Furthermore, the 18-24 age group represents 17% of the UI claims filed. However, only 11% of Mecklenburg County accounts for this 18-24 age group. The graph by age down unemployment claims in Mecklenburg County by age.
March Claim Data by Gender
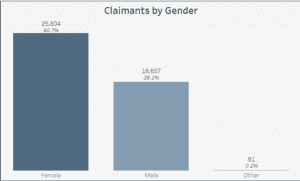
Another substantial disparity seen in unemployment claims is amongst women. Women are more likely to file for unemployment now than their male counterparts. Women represent almost 61% of UI claimants but make up only 52% of the total population in Mecklenburg County. Two of the top three sectors hurt by the increase in unemployment, Education & Health Services and Leisure & Hospitality, are female-dominant industries. According to data from UNC Charlotte (UNCC), “women make up nearly nine out of 10 nursing assistants, most respiratory therapists, a majority of pharmacists and an overwhelming majority of pharmacy aids and technicians,” (Meggs, 2020). UNCC also states that women make up greater than two-thirds of fast-food counter and grocery store checkout employees (Meggs, 2020). The corresponding graph by gender highlights this disparity, illustrating the unemployment claims in Mecklenburg County by gender.
March Claim Data by Race
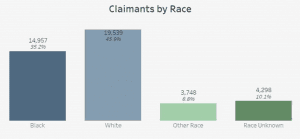
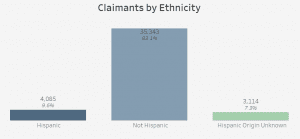
The last area of disproportionality is in the Black/African American community. With respect to Mecklenburg, this community represents 35.2% of unemployment claims but only 33% of the Mecklenburg County population. Furthermore, white residents represent 57% of the population in Mecklenburg County, but only 45.9% of the total UI claims. Even though Latinx members historically can be grouped with white demographic data, we do know that 9.6% of UI claimants in Mecklenburg
March Claim Data by Ethnicity
County were of Hispanic origin. While this is lower than the baseline 14% of Mecklenburg County Hispanic representation, we’re seeing that Hispanic communities are witnessing an all-time high unemployment at 18.9% nationally (Jones, 2020). The corresponding graphs by race and ethnicity illustrate the disparities in Mecklenburg County unemployment claims.
Due to long-term, nation-wide structural and systemic inequalities, people of color are more likely to be employed in lower-wage positions. As such, these low-paying jobs have been impacted most by layoffs (Jones, 2020). People of color occupying many of these jobs also have less resources and access to opportunities to withstand the challenges of an economic recession (Jones, 2020). Additionally, essential workers are more likely to be nonwhite women holding low-paying jobs that do not offer family-sustaining wages (Meggs, 2020). With other demographics collecting more on unemployment, Black and Latinx communities are less able to maintain financial stability in times of need.
Written By: Nahom Kahsay, Labor Market & Performance Research Fellow
Edited By: Kevin Loux, Director of Labor Market Intelligence
References
Jones, C. (2020, May 8). Historic layoffs take biggest toll on Blacks, Latinos, women and the young. Retrieved from https://www.usatoday.com/story/money/2020/05/08/covid-19-layoffs-take-toll-women-people-color-and-young/3094964001/
Jones, C. (2020, May 4). Low-income and younger workers bear brunt of coronavirus-related layoffs, study finds. Retrieved from https://www.usatoday.com/story/money/2020/05/04/coronavirus-layoffs-take-biggest-toll-low-income-young/3058469001/
Meggs, M. (2020, May 5). The gendered implications of COVID-19. Retrieved from https://ui.uncc.edu/story/coronavirus-charlotte-women-gendered-effects