
14 Jul A Look at the Workforce Demographics in Mecklenburg County

A Look at the Workforce Demographics in Mecklenburg County
As the workforce development board serving Mecklenburg County, we want to help create a thriving workforce system that generates economic prosperity for all. If you’re a local employer or policymaker, it can help to know the community in which you operate or represent. Here, we will look at the demographic breakdown by gender and race in Mecklenburg County and the local job industries. This will allow us to see if there are any areas for improvement to ensure economic prosperity for all.
Gender
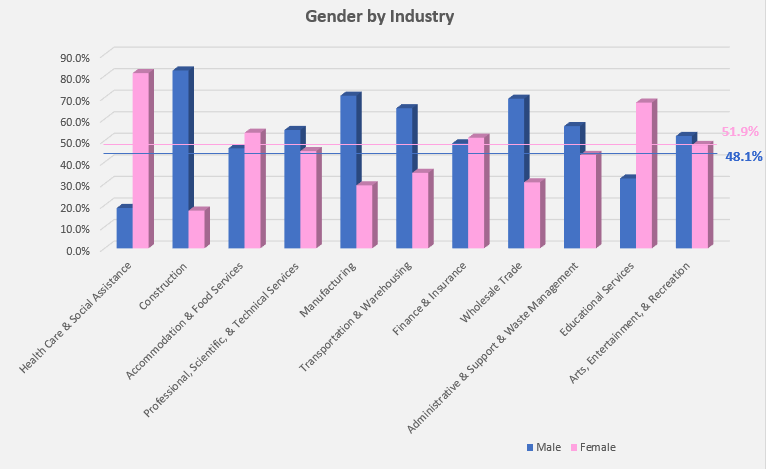
Chart 1, Gender by Industry: This chart shows the breakdown by gender between each industry for Mecklenburg County. The trendlines across the chart represent the whole population of Mecklenburg County, with males making up 48.1% and females at 51.9%
Race

Chart 2, Race by Industry: This chart shows the breakdown by race between each industry for Mecklenburg County. The trendlines across the chart represent the whole population* of Mecklenburg County with white making up 46.3%, Black/African American at 31.1%, Hispanic at 13.4%, and Asian at 6.0%.
Areas of Concern
For areas of concern, we are looking at how the numbers of workers compare within an industry and how they compare to the county. We will mention any industry that may not have a full representation of the Mecklenburg community. While there are many groups that could be addressed, we will only highlight the ones with the highest level of difference.
- Health Care & Social Assistance: In this industry, females make up a majority of this field having over 4.3 times as many workers as males.
- Construction: Males make up most of this industry, having over 4.7 times the number of female workers. When you compare construction workers to the county’s demographics, you see that the 10.4% of workers that identify as Black/African American are almost 21% lower than their makeup of the county’s 31.1%.
- Professional, Scientific, & Technical Services: The 12.8% of workers that identify as Black/African American in this industry are over 18% lower than the 31.1% in Mecklenburg County.
- Manufacturing: There are over 2.4 times the number of male workers compared to female workers in this industry.
- Transportation & Warehousing: In this industry, there are almost 1.9 times as many male workers as female workers.
- Wholesale Trade: Here, we see almost 2.3 times as many male workers as female workers. We also see that the 16.4% of workers identifying as Black/African American are almost 15% lower than the 31.1% of the county.
- Educational Services: In this industry, we see over twice as many female workers as male workers. We also see Black/African American identifying workers being almost 11% lower than those living in the county.
- Arts, Entertainment, and & Recreation: Lastly, we see those identifying as Black/African American being 14% lower in this industry compared to the same group’s makeup of the county.
It is important to understand what local industries may not have representation from their community. An inclusive workforce should be a goal for all because it benefits all. Aside from helping create economic prosperity for all, a diverse workplace can also benefit employers by increasing productivity.
If you want help attracting talent to your business, please reach out to us here.
Stay up to date with our Mecklenburg County Labor Market Dashboard.
By: Ryan Nelson
Data Analyst
Notes:
*For breakdown of population by race, percentages were used by those that identify as that race alone.
Update: Mecklenburg County Demographic data was taken from www.census.gov prior to the release of July 1, 2021, estimates. July 1, 2021, estimates are as follows:
- Male: 48.3%
- Female: 51.7%
- White alone, not Hispanic/Latino: 45.3%
- Black alone: 33.3%
- Hispanic/Latino alone: 14.1%
- Asian alone: 6.5%
Industry demographic data was taken from Emsi Burning Glass.